5 simple calculations everyone should know
If you look at a map and decide you want to drive to a location across the country, how do you know where to go unless you know where you are?
The same applies to our finances. In order to set goals and achieve our goals, it’s necessary to determine where we are right now.
A helpful tool for this is ratios and benchmarks.
A financial ratio provides a way to assess different aspects of our finances and compare it with others (benchmarks), or best practices.
Here are five of the core ratios I use with my clients.
No time to waste, let’s get into it:
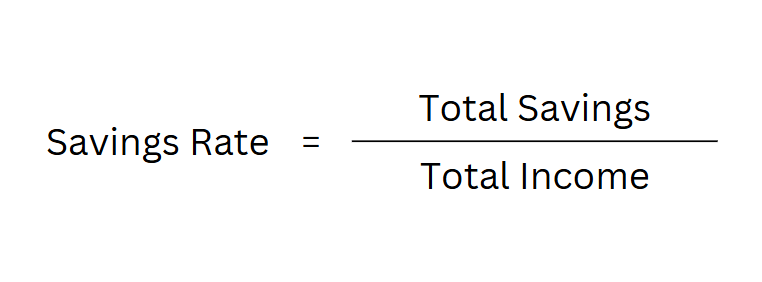
Savings Rate
This ratio determines how much of our income we’re saving.
The calculation:
Example:

If Jeff saves $1,000 per year, and he makes $50,000 annually, his savings rate would be:
Benchmark: 10-15% depending on age and goals
Emergency Fund Ratio
This ratio determines how long we can sustain our bills in an emergency event such as job loss.
The calculation:

Example:
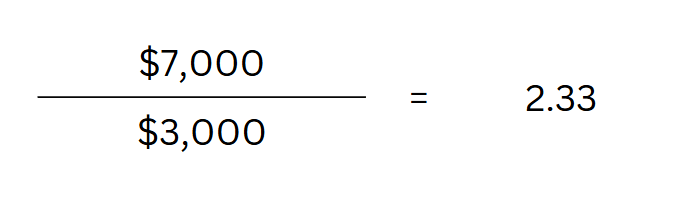
If Jeff has monthly expenses of $3,000 and has $7,000 in savings, his Emergency Fund ratio would be:
This means Jeff could continue paying bills for 2.33 months without an income.
Benchmark: 3-6 months (up to 12 months for those with difficult-to-obtain jobs)
Return on Investments (ROI)
This ratio shows how well our investments are performing.
Calculation:

Example:
If Julia has $50,000 in an IRA and she contributes $3,000, and at the end of the year her account is worth $55,000, her ROI would be:

Benchmark: Varies by industry. Historically, the U.S. stock market has returned an average of ~10% annually, though future returns are not guaranteed.
Note: Investments such as real estate have slightly different calculations for ROI.
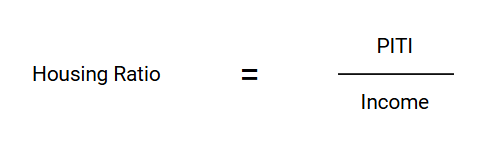
Housing Ratio
This determines how much of our income is spent on housing expenses.
This ratio is made up of four parts: Principal, Interest, Taxes, and Insurance (PITI).
Calculation:
Example:
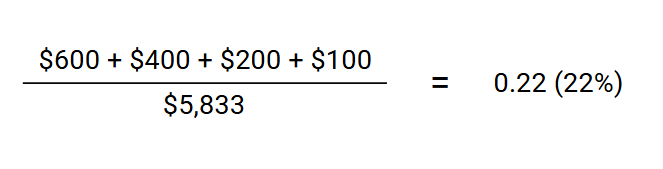
Julia has a mortgage on her home. Each month she pays $600 toward the principal, $400 in interest, $200 in taxes, and $100 for insurance.
Julia earns $70,000 per year ($5,833/month)
Benchmark: Housing Ratio should be under 28%.
Non-housing Debt Ratio (NDR)
While this is not a standard ratio, I use this with my clients to understand debt levels outside of a mortgage.
Calculation:

Example:
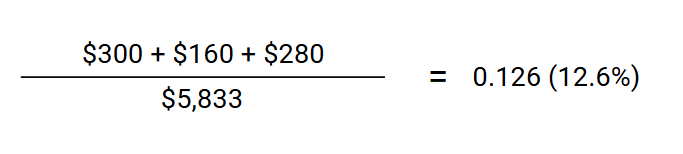
Aside from her mortgage, Julia has a car payment ($300), a credit card ($160), and student loans ($280).
To calculate her NDR:
Benchmark: We want this number to be as close to 0 as possible.
Understanding these numbers can help point us in the right direction and help us know if we’re on track. They are a tool in the financial planning tool kit, and I hope they’re helpful for you as well.
If you have any questions about these ratios or would like to discuss them further, send me a message!
Quote of the week: "Wealth consists not in having great possessions, but in having few wants.” --Epictetus